Generative Images with SVG.js
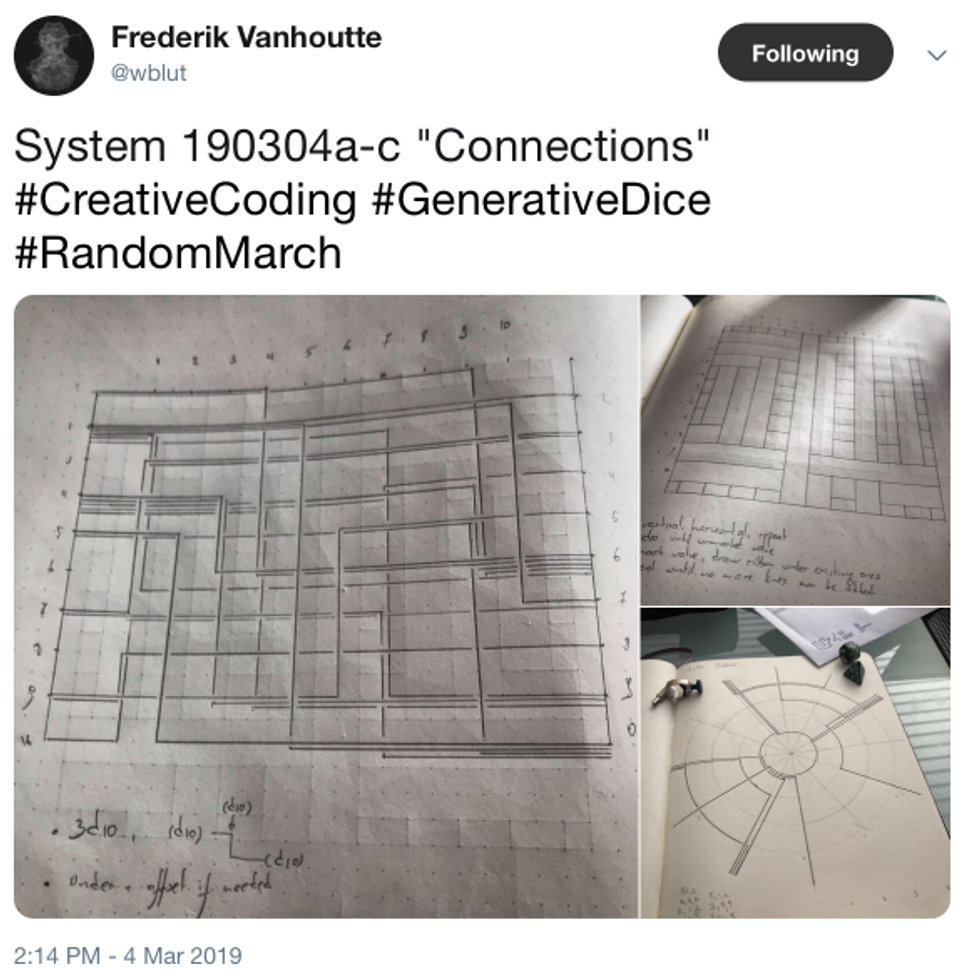
I recently came across some simple but fun generative drawings posted by FrederikVanhoutte.

The algorithm governing their creation is quite simple:
- Create a 10x10 square grid
- Roll a 10-sided die to pick a starting location along the left-hand side of the grid (
y1) - Roll a 10-sided die to determine how long to draw a line toward the right-hand side of the grid (
x) - Role a 10-sided die to determine the ending location along the right-hand side of the grid (
y2) - Draw three, connected lines with these vertices:
(0, y1), (x,y1), (x,y2), (10,y2)
There are two additional aesthetic rules that govern the appearance of the lines in the drawing:
- If two line segments would overlap, offset the second until it does not overlap any prior segments
- If a line crosses another, create a gap at their intersection to keep them from touching
Frederik’s postings show pen and paper drawings he created using the above rules, a straight-edge, and a 10-sided die. I wanted to see the results would look like when imagined on a computer screen.
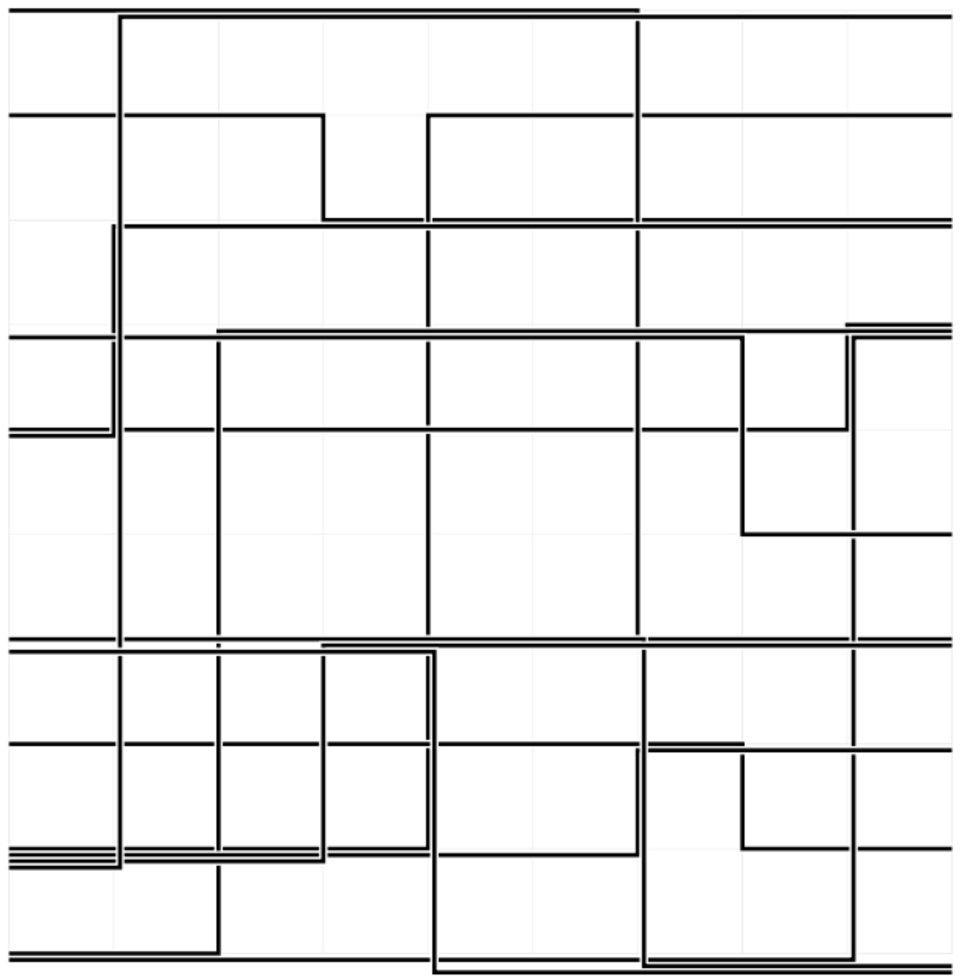
A brief search revealed svg.js, a nice library for creating scalable vector graphics (SVG) directly in a browser page. The docs leverage JSFiddle to do this, and that is the approach I took as well. The code for my generative version is here.[1] Press the “Run” button in the upper left-hand corner of your browser to generate new images.

Comments on the Code
I am not a strong Javascript programmer, but I think the code is fairly straightforward. I also think it does a good job replicating what Frederik achieved with pen and paper. Note that I deviated slightly from above when calculating the x value: instead of a 10-sided die, I roll one with 9 sides.
The code starts out with some configuration settings that affect the appearance of the generated image. Next are two function definitions xmur3 and sfc32 which I shamelessly copied from a stackoverflow posting. These two functions allow me to generate random values much like Math.random but with control of the initial seed values for the random sequence. This lets me recreate any image as long as I know the original seed values. For simplicity, I use the value from Date() which returns a string showing the current date and time.
After the random routine setup, I create a new SVG image and attach it to the “canvas” div element on the web page. The routine offsets takes in three values (y1, x, y2) and returns non-overlapping values which drawFigure uses to create the vertices of the lines it draws. To achieve the gap effect mentioned above when two lines intersect, I first draw the lines with a wide pen in white to erase any intersections, and then I draw with a narrower pen in black for the final lines. Finally, I create new SVG image that shows the random seed value just in case I wish to recreate the image in the future.
Code
// Replicate 'System 190304a-c "Connections"'' by Frederik Vanhoutte
// https://twitter.com/wblut/status/1102557824192835584

const lineCount = 14
const lineWidth = 0.04
const gap = 0.02
const lineWidthAndGap = lineWidth + gap

const gridAttr = {
  width: 0.01,
  color: '#eee'
}
const pathAttr = {
  width: lineWidth + gap * 2,
  color: "#fff"
}
const lineAttr = {
  width: lineWidth,
  color: "#000"
}

// https://stackoverflow.com/questions/521295/seeding-the-random-number-generator-in-javascript
function xmur3(str) {
  for (var i = 0, h = 1779033703 ^ str.length; i < str.length; i++)
    h = Math.imul(h ^ str.charCodeAt(i), 3432918353);
  h = h << 13 | h >>> 19;
  return function() {
    h = Math.imul(h ^ h >>> 16, 2246822507);
    h = Math.imul(h ^ h >>> 13, 3266489909);
    return (h ^= h >>> 16) >>> 0;
  }
}

// Obtain a random number generator with given initial state
function sfc32(a, b, c, d) {
  return function() {
    a >>>= 0;
    b >>>= 0;
    c >>>= 0;
    d >>>= 0;
    var t = (a + b) | 0;
    a = b ^ b >>> 9;
    b = c + (c << 3) | 0;
    c = (c << 21 | c >>> 11);
    d = d + 1 | 0;
    t = t + d | 0;
    c = c + t | 0;
    return (t >>> 0) / 4294967296;
  }
}

// Set to constant string value to recreate the same image
const randSeed = Date() // "Tue Mar 05 2019 14:03:31 GMT+0100 (CET)"
const seedGen = xmur3(randSeed)
const randGen = sfc32(seedGen(), seedGen(), seedGen(), seedGen())

var canvas = SVG().addTo('#canvas')
canvas.size('100%', '100%')
canvas.viewbox(-1, -1, 11, 11)

var xpaths = [
  [0, 0, 0, 0, 0, 0, 0, 0, 0, 0],
  [0, 0, 0, 0, 0, 0, 0, 0, 0, 0],
  [0, 0, 0, 0, 0, 0, 0, 0, 0, 0],
  [0, 0, 0, 0, 0, 0, 0, 0, 0, 0],
  [0, 0, 0, 0, 0, 0, 0, 0, 0, 0],
  [0, 0, 0, 0, 0, 0, 0, 0, 0, 0],
  [0, 0, 0, 0, 0, 0, 0, 0, 0, 0],
  [0, 0, 0, 0, 0, 0, 0, 0, 0, 0],
  [0, 0, 0, 0, 0, 0, 0, 0, 0, 0],
  [0, 0, 0, 0, 0, 0, 0, 0, 0, 0]
]

var ypaths = [
  [0, 0, 0, 0, 0, 0, 0, 0, 0, 0],
  [0, 0, 0, 0, 0, 0, 0, 0, 0, 0],
  [0, 0, 0, 0, 0, 0, 0, 0, 0, 0],
  [0, 0, 0, 0, 0, 0, 0, 0, 0, 0],
  [0, 0, 0, 0, 0, 0, 0, 0, 0, 0],
  [0, 0, 0, 0, 0, 0, 0, 0, 0, 0],
  [0, 0, 0, 0, 0, 0, 0, 0, 0, 0],
  [0, 0, 0, 0, 0, 0, 0, 0, 0, 0],
  [0, 0, 0, 0, 0, 0, 0, 0, 0, 0],
  [0, 0, 0, 0, 0, 0, 0, 0, 0, 0]
]

// Offset given values based on previous lines
function offsets(y1, x, y2) {

  // First calculate offsets
  const ry1 = ypaths[y1]
  const ry2 = ypaths[y2]
  const rx = xpaths[x]

  const yo1 = Math.max(...ry1.slice(0, x))
  const yo2 = Math.max(...ry2.slice(x, 10))
  const rxs = y2 > y1 ? rx.slice(y1, y2) : rx.slice(y2, y1)
  const xo = Math.max(...rxs)

  // Now update values for future offset calculations
  for (var i = 0; i < x; ++i) {
    ry1[i] = yo1 + lineWidthAndGap
  }
  for (i = x; i < 10; ++i) {
    ry2[i] = yo2 + lineWidthAndGap
  }

  if (y2 > y1) {
    for (i = y1; i < y2; ++i) {
      rx[i] = xo + lineWidthAndGap
    }
  } else {
    for (i = y2; i < y1; ++i) {
      rx[i] = xo + lineWidthAndGap
    }
  }

  return [y1 + yo1, x + xo, y2 + yo2]
}

// Generate random integer in range [x, y)
function rint(x, y) {
  return Math.floor(randGen() * (y - x + 1)) + x
}

// Draw faint graph paper lines
for (var i = 0; i < 10; ++i) {
  canvas.line(i, 0, i, 9).stroke(gridAttr)
  canvas.line(0, i, 9, i).stroke(gridAttr)
}

function drawFigure() {
  const y1i = rint(0, 9)
  const y2i = rint(0, 9)
  if (y2i == y1i) return drawFigure()

  const yxy = offsets(y1i, rint(1, 8), y2i)

  const y1 = yxy[0]
  const x = yxy[1]
  const y2 = yxy[2]
  const pts = [0, y1, x, y1, x, y2, 9, y2]
  canvas.polyline(pts).fill('none').stroke(pathAttr)
  canvas.polyline(pts).fill('none').stroke(lineAttr)
}

for (var j = 0; j < lineCount; ++j) {
  drawFigure()
}

canvas = SVG().addTo('#canvas')
canvas.size('100%', '100%')
canvas.text('Seed: ' + randSeed).font({
  family: 'Arial',
  size: 14
})
![Validate my RSS feed [Valid RSS]](/images/valid-rss-rogers.png)