![[Valid RSS]](/images/valid-rss-rogers.png "Validate my RSS feed")
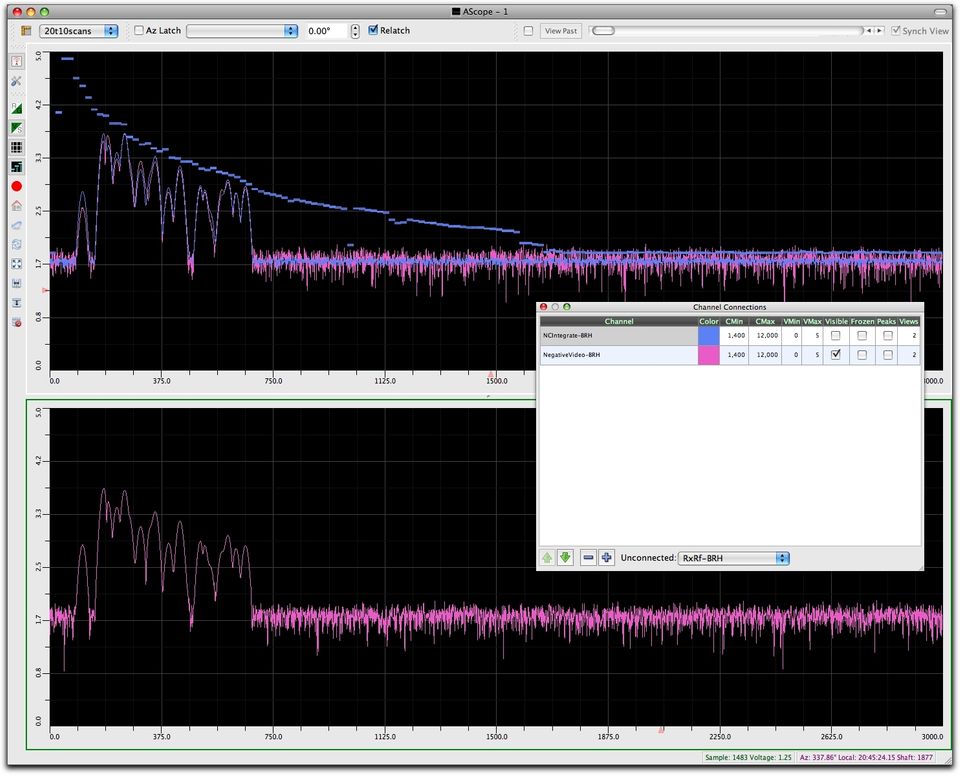
A-Scope Signal Display
An A-scope is a plot of individual radar returns, where the X axis represents time or distance, and the Y axis is intensity or sample count. I wrote this using Qt library (no OpenGL needed here). This application supports multiple input channels (we were showing 20 or so simultaneously), multiple windows, and multiple splitting of views, with each view showing its own set of channels.
The application also supported a buffered mode which would allow the user to scroll back N seconds to see the signal in the past. This worked fine, but in the end the users did not really use it that much. Instead, they would rely on an azimuth trigger that would capture some frames between two azimuth values and look at that.